General information
This manual refers to the basic edition of the Crypto&Stocks Investment Tracker v1.0. If you are interested in one of the different guides for the premium trackers, please choose another guide from the menu.
Welcome to your newly found unique investment tracker. The tracker works for cryptocurrencies and stocks alike! Not only will it track your investments portfolio for you, but it will also provide you with quality tools such as relevant newsfeed and the financial summary tool. You can have this version for absolutely free. This version offers most investors all the tools they need! However, if you are searching for more features such as net worth tracking and an overview of your realized gains (FIFO/LIFO), check out the premium trackers.
This page consists of two parts. The first part describes how to set up the tracker and the second part describes the essential sheets.
Setting up the tracker
In the setup sheet, perform the following actions, in these order:
- Step 1: Fill in your data in the account box (maximum up to thirty). For example, enter different brokers and/or exchanges. It is possible to increase this limit. Contact me for more information.
- Step 2: Go to the History sheet. Take a look at how the data has been entered. Make sure to enter the slang of the currency instead of the symbol. For example do not use “BTC” but use “bitcoin”. Then delete column A up and till E. Leave column “F”. This column automaticallycalculates the average price based on your total purchase costs and the amount of shares. Then delete column “G” and “H”. Now fill in the history sheet with your transaction history. Your broker and/or exchange often provides this data. Add any fee’s to the total purchase cost. Do not change any data here.
- Step 3: Go to the positions sheet. Add the “=” sign in cell A3 so that the text turns into a formula. This custum formula perform calculation on your history sheet and produce three columns: symbol, shares and average cost for shares according to the FIFO method. The rest of the calculations are then performed based on these three columns. Do not change anything here, but instead change the input data in the History sheet.
- Step 4: Inside the cryptocurrency box, you will find a list of the cryptocurrencies you own in column “G’. Fill in the “Symbol/Currency” in column “F” similar to the example. The data in column “F” and “G” are required to create a sparkline in the dashboard.
- Fill in the currency you wish as output for your portfolio in the “Main currency” box. For example, choose “USD” if from the United States or “EUR” if from Europe.
- Step 6: Fill in the original currency in which you purchased the stock inside the designated box for stocks. Change only the data in column N!
- Step 7: Click on ‘activate trigger’. This will activate a trigger for the IMPORTHTML functions which retrieve the price of cryptocurrencies (15 mins) and sector/industry (12 hours). You will need to give authorisation in order for the script to run. This is standard procedure for running ANY script. Give authorisation by clicking continue > chose your gmail account > advanced > go to portfolio (unsafe).
- Step 8: Optional: Update price data of cryptocurrencies and sector/industry for stocks manually in the custom menu as required
Additional information
- Price data for crypto is retrieved from Coingecko through the IMPORTHTML function. It refreshes every hour automatically. If you activate a trigger it will force a refresh every 10 minutes. You MUST use the slang of the cryptocurrency as opposed to the symbol. For example, bitcoin instead of BTC.
- Check if you are using the correct slang by searching your coin at the coingecko website. Then, look at the last part of the URL. This has to be exactly the same as the slang you are using. For example, for THETA the link is: “https://www.coingecko.com/en/coins/theta-network“. Meaning the slang to be used in the history sheet is “theta-network”.
- Price data for stocks is retrieved with the Googlefinance function and refreshes every 20 minutes. Stocks and the local currency must be written in such a manner that google finance can find them. Write the stock exchange before the symbol if you receive the incorrect price, for example NYSE:GME instead of GME.
- The total purchase costs in the history sheet must assume all costs including exchange fees and transactional costs.
- The money-weighted rate of return (MWRR) is used to calculate the performance of your total portfolio. Make sure to input all cash inflows & outflows correctly if you want this number to be reliable (e.g., all deposits & withdrawals from accounts).
- The “cryptofinance” function used to create a sparkline in the dashboard has a limit of 25/requests per day. If you don’t see a graph pull up, it is possible that you reached your limit.
- If the spreadsheet is too large or too small for your screen, go to “view” and change the “zoom”. For example, on a laptop that is 15 inch, you may prefer a zoom of 75%.
- The tracker supports by default 100 stocks and up to 30 cryptocurrencies. It is possible to extend this to as many as you like. Contact me for more information regarding this matter.
Description of spreadsheet
Dashboard
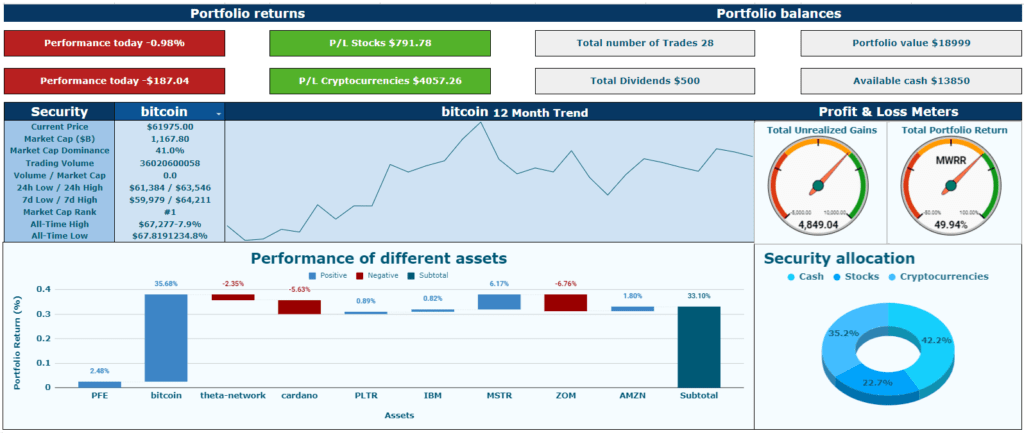
The first sheet you will encounter after the Setup sheet is the Dashboard. Here, you will find a summary of the essential parts of your portfolio. On the top, you will find your daily performance and the performance of your cryptocurrencies and stocks. Moreover, you can view your current cash balance and account balance on the top right. In the middle, on the right, you can see your total unrealized gains and the performance of your entire portfolio.
If you wish to view key metrics on an asset you own, click on the arrow next to the symbol’s name (in this case, bitcoin), and the tracker will present you with some financial metrics and a sparkline! The waterfall graph illustrates the unrealized amount your portfolio has gained (or lost) and the relative contribution of the assets. For example, you could have lost 90% on a stock, but if you only paid 100 dollars for that stock, then the impact on your portfolio may still be small.
History
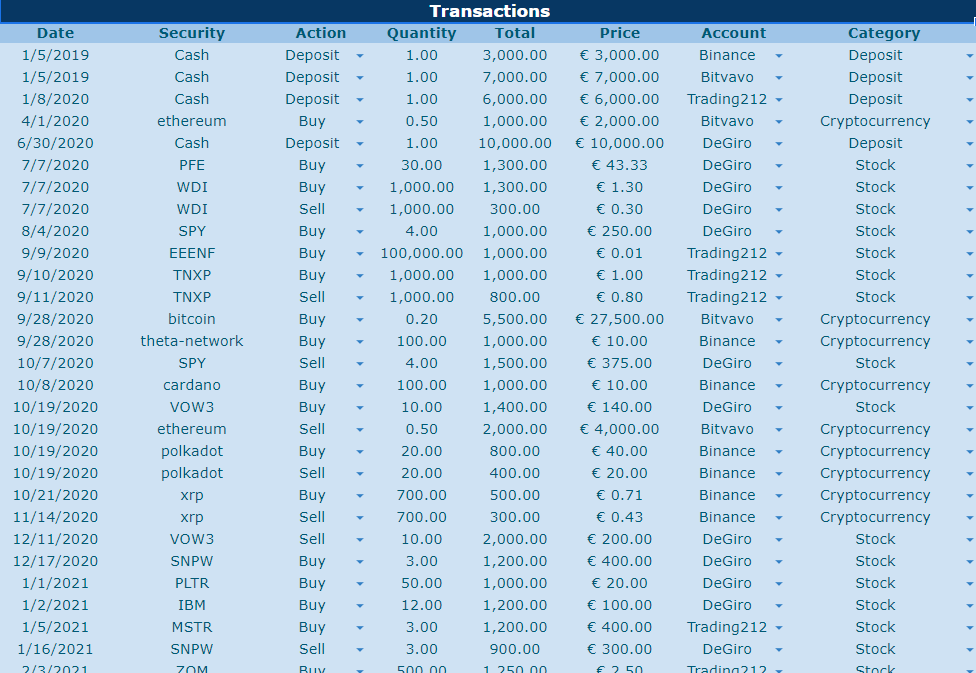
This is the data input sheet. As a user, you must fill in this sheet with your data. The spreadsheet then uses the information inside this datasheet to perform all calculations. If you wish to change anything in the rest of the spreadsheet, then do so by changing the history sheet.
Positions
Arguably the most crucial sheet is located in the “Positions” tab. This sheet provides you with an overview of all your current holdings. It includes vital info such as average cost basis, portfolio allocation, cost basis, sector, industry, market cap, price change daily, purchase cost, position value, gains or losses, and portfolio return.
Analysis of portfolio
This sheet will provide you with a graphical overview of your investments which will help you in your future decision. You may gain some insights by assessing the different allocations within your portfolio and determining if re-balancing is necessary. Furthermore, you may gain insight into how well diversified your portfolio is by the industry and sector allocation. Finally, the account balance graph presents an overview of your balances per account. Hover over with your mouse to view specific values.
Investor return
The final sheet on the investment tracker will provide you with an overview of all your returns over one holding period. In the drop-down list in cell “H4,” you can choose whether you wish to view your total portfolio, cryptocurrencies, or stocks. The graphs in the sheet are linked dynamically, meaning they will change based on the values of the drop-down list and any changes made in the “History” sheet. The first chart will provide you with gains or losses for an individual asset; the second chart will provide your portfolio return. This is especially useful since one of your holdings may have lost 90% of its value; however, if you only spend $100 on that holding, the impact on your total return might be minimal. The final charts are gauge meters displaying your total return according to the money-weighted rate of return and the total amount of dividends received.
Newsfeed
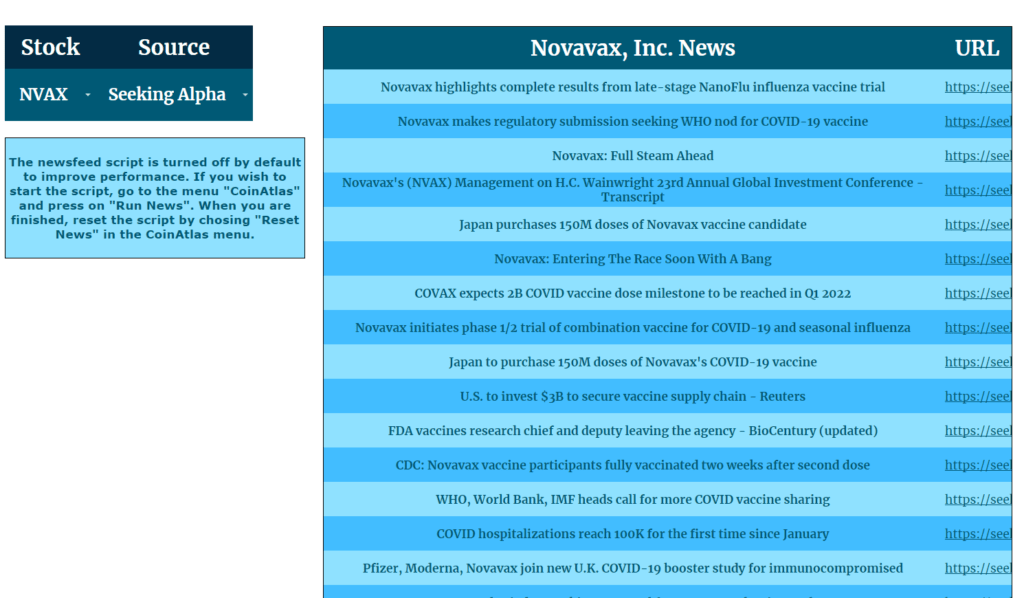
In the Newsfeed sheet, you can go to cell “D7” and click on the arrow, and the tracker will present you with a drop-down list of all your stock holdings. Chose one stock holding and then click on the source of your choosing. For stocks, you can select from “Seeking Alpha” or from “Yahoo Finance.” If you are not interested in news from stocks, you can also choose to look up general news on cryptocurrency from “Cryptoninjas,” “Coindesk,” or “Cointelegraph.”
Financial Screener
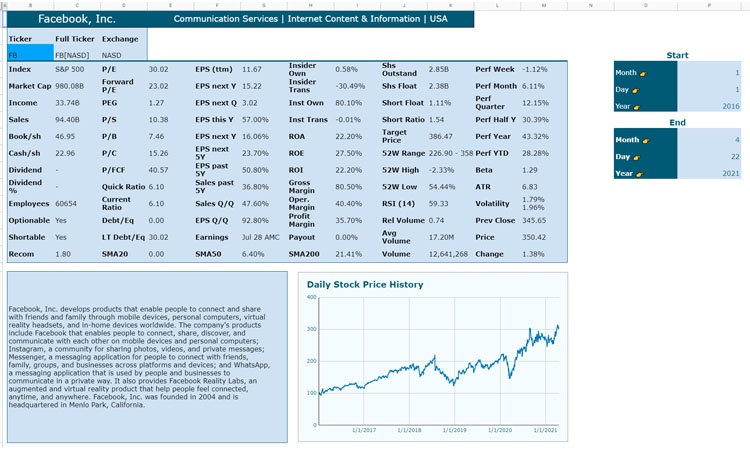
The following tool available for your use is the “Financial Summary.” This sheet extracts a table from finviz.com. The table provides you with financial information on a specific stock. Enter in cell “C3,” the symbol of the stock of your interest. The table should update automatically. Unfortunately, Finviz only supports US stocks. A graph displaying the historical price is also present. You can change the chart by entering a different date in cell “P4” up and till cell “P10”.
32 Comments
Diogo · November 24, 2021 at 3:45 pm
Hi,
Finally a tracker for both stocks and crypto that I can easily use…
Is this tracker paid? I seem to be unable to find a link to download anywhere…
Pashtun · November 24, 2021 at 4:05 pm
Hi Diego,
Thanks for your interest in the tracker. As explained at the homepage and the most recent news update, the basic edition of the tracker is free and will remain free. Gain access by subscribing to my newsletter available at homepage (you will receive automatic email with link to tracker). Premium edition is free since it is in beta mode untill 01-01-2022. To gain access, read this.
Emily · November 29, 2021 at 12:24 pm
Hi there, I’ve tried subscribing using 2 different email addresses but nothing’s been sent to me, it’s not in my spam folder either. Could you please check? Thanks. Just wanna try out the basic one first as I’m just a beginner.
Pashtun · November 30, 2021 at 2:53 pm
Just sent you an email with the basic tracker! Let me know if you need any more help.
aziz · December 7, 2021 at 10:34 am
Hi,
I have registered to get the link, but still didn’t receive any mail.
Thanks for your assistance.
Pashtun · December 8, 2021 at 5:50 am
I just sent you an email with a link to the tracker
aziz · December 8, 2021 at 11:04 am
Got the link.
Thanks for sharing.
Chems · December 22, 2021 at 11:19 am
Hi,
I have registered to get the link, but still didn’t receive any mail.
Thanks for your assistance.
Pashtun · December 23, 2021 at 12:35 pm
Link is sent to you. Check your email.
Rahul · January 5, 2022 at 1:30 pm
Hi,
I’ve registered here but didn’t get any email or link for tracker.
Please let me know how to get that.
Thanks in advance.
Jeff · January 6, 2022 at 10:17 pm
Hi,
Can I please get a link to the free crypto tracker? Thanks.
Pashtun · January 10, 2022 at 6:17 pm
Hi Jeff,
The way to get access is by subscribing to my newsletter at the homepage (scroll down to the bottem).
If you don’t find an automatic email with the link, please check spam folder. Otherwise comment here again and I will send it to you personally.
Best regards,
Pashtun
Art · January 17, 2022 at 11:52 pm
Thank you so much for this. I have added my broker names to the account, however only 5 of them are coming up, and not in the specific order. Anyway I can make all the brokers appear in the history when I put in the trades?
Thank you
Pashtun · January 22, 2022 at 12:28 pm
Hi Art, yes there is a way to increase the amount of brokers. Select the column in the history sheet, right click, click on data validation, increase the amount of cells in the setup sheet, e.g. from just 5 cells to 20 cells (this will then allow 20 brokers to be selected).
Let me know if you still have trouble.
cosset · January 20, 2022 at 11:35 am
Hi signed up but no link visible on my inbox.
Regards.
Pashtun · January 22, 2022 at 12:30 pm
Will send you the link!
Donald Lalonde · February 2, 2022 at 3:48 pm
Hi Pashtun, I am looking to get the link to the Basic Crypto&Stocks Investment tracker please. Thank You
Pashtun · March 1, 2022 at 7:04 pm
Email has been sent.
Carlos Oliveira · February 20, 2022 at 11:43 am
Hi,
I’ve registered here but didn’t get any email or link for tracker.
Please let me know how to get that.
Thanks in advance.
Pashtun · March 1, 2022 at 7:04 pm
Email has been sent.
online pharmacies · February 28, 2022 at 4:03 pm
I’m not sure exactly why but this web site is loading very slow for me.
Is anyone else having this problem or is it a problem on my end?
I’ll check back later on and see if the problem still exists.
Pashtun · March 1, 2022 at 7:01 pm
Unfortunately, there was a spam attack on February 28th. The website should have recovered by now. Let me know if you still have issues.
Nik · March 3, 2022 at 6:49 pm
Hi Pashtun,
To be honest, I did not receive an email with the link to the spreadsheet. Could you please share it with me?
Also I am very excited to try out your premium tracker! Wouldn’t you mind sharing how to get the access to the premium one? If it is out from beta version, how much would it cost?
Thank you for helping us on our financial journey. 🙂
Yours sincerely,
Nik
Pashtun · March 3, 2022 at 6:56 pm
I sent you an email with the link. The cost will most likely be 25 euros.
Jay · March 26, 2022 at 6:08 pm
Hi Pashtun,
Thanks for this tool, seems to be great!
Just subscribed to the newsletter. can you pls share the link when possible?
Cheers!
J
Pashtun · April 21, 2022 at 12:19 pm
Please check your inbox, including spam mail.
drugstore online · March 31, 2022 at 8:50 am
I have been surfing online more than 4 hours today, yet I never found any interesting
article like yours. It is pretty worth enough for me.
In my view, if all website owners and bloggers made good content as you did, the
web will be much more useful than ever before.
Pashtun · April 21, 2022 at 12:19 pm
Thank you for the compliment!
online medicine to buy · April 8, 2022 at 12:53 pm
Heya i’m for the primary time here. I found this board and I find It really helpful
& it helped me out a lot. I hope to offer one thing back and aid others such
as you aided me.
Pashtun · April 21, 2022 at 12:20 pm
Glad to you hear I could help you!
Lawrence · April 13, 2022 at 5:49 pm
Hi Pashtun
I Have been searching for a Crypto-Tracker Program, and came across COINATLAS, which looks fantastic. I have tried to subscribe, but am not receiving any email links to the spreadsheet?
Many thanks
Lawrence
Pashtun · April 21, 2022 at 12:21 pm
Just sent you an email and provided you with the link to the premium tracker.