The first steps in setting up the tracker
This manual refers to the “Crypto Investment Tracker v1.1 – Premium edition“. I will keep this page updated as newer versions are released. Learn more about this update here. There is a video available for an older version of this tracker (v1.0). See the video below. The rest of the manual applies to the most recent version. Check the FAQ if you still have questions left after reading this guide.
Welcome to your newly found premium investment tracker. The tracker which works for cryptocurrencies and stocks alike! Not only will it track your investments portfolio for you, it will also track your net worth, help you with taxes and provide you with quality tools such as relevant newsfeed and the financial summary tool! This is the only tracker you will need! For this tracker you will never need a paid subscription!
Temporary available: untill the 1st of january 2022, this tracker is free. Learn more on how to gain access here.
This page consists of two parts. In the first part, a description of how to set up the tracker is provided and in the second part contains a description of all essential sheets. The goal is that every user is capable of using the spreadsheet optimally.
In the setup sheet, perform the following actions, in these order:
- Step 1: Fill in your data in the account box. For example, enter different brokers and/or exchanges. Maximum up to thirty.
- Step 2: Go to the History sheet. Take a look at how the data has been entered. Make sure to enter cryptocurrency symbols. For example use “BTC” instead of “bitcoin”. Then delete column A up and till E. Leave column “F”. This column automaticallycalculates the average price based on your total purchase costs and the amount of shares. Then delete column “G” and “H”. Now fill in the history sheet with your transaction history. Your broker and/or exchange often provides this data.
Important note: If your broker does not provide you with a crypto to fiat conversion number, but instead a crypto to crypto conversion (e.g. bnb/btc conversion), then look up the historical price at time t at your exchange in fiat and use the fiat number to sell bnb and buy btc. For example, if I converted 10 BNB into 0.05 bitcoins at 03/01/2021 at 13:00 using binance, then I can go to their website and find the historical price of 10 BNB (=2100 euro). In the spreadsheet, I would input sell 10 BNB for total cost of 2100 euro, followed by a second input of buy 0.05 BTC with total cost of 2100 euro. - Step 3: Go to the menu “CoinAtlas” and press the build report (choose either LIFO or HIFO, learn more about the difference and implications for taxes here). Make sure to give authorisation by clicking continue > chose your gmail account > advanced > go to portfolio (unsafe). This is standard procedure for running ANY script!
- Step 4: Fill in the currency you wish as output for your portfolio in the “Main currency” box. For example, choose “USD” if from the United States or “EUR” if from Europe.
- Step 5: Inside the cryptocurrency box, you will find a list of the cryptocurrencies you own in column “I’. Fill in the slug of the cryptocurrency in column “H” and a “Symbol/Currency” in column “J” similar to the example. The data in column “H” and “J” are required for the tool “Watchlist“.
- Step 6: Register at coinmarketcap and retrieve your personal API key from here. Go to Extensions> App Script > CoinAtlas > Add your personal coinmarketcap API key inside the function “coinMarketCap”, specifically here: “X-CMC_PRO_API_KEY”: ‘fbe6a0e0-xxxx-xxxx-xxxx-xxxxxxxxeec9′”
- Step 7: Fill in the original currency in which you purchased the stock inside the designated box for stocks.
- Step 8: Once your history is completely filled out, manually fill in the date of today (do not use =TODAY() function!). From this moment onwards, your lifetime net worth will be tracked. Click on “activate triggers” to start running the functions which track your networth. From this moment onwards, your lifetime net worth will be tracked.
- Step 8: Click on “activate triggers” to start running the functions which track your networth. WARNING: Only click once on the trigger!!! If you accidently clicked twice or more, then you will need to remove the triggers manually. See FAQ for more info.
- Step 8: Update price data of cryptocurrencies and sector/industry for stocks in the custom menu as required
- Step 9: Optional: Turn off/on newsfeed in custom menu.

Additional information
- Price data is retrieved from CoinMarketCap through an API. There is a limit to 333/calls per day and 10000 calls/month. Once you activate trigger it will run every 5 minutes.
- The top 100 coins of coinmarketcap are tracked. If you require more, then consider changing the limit inside the coinmarketcap function (tools > script editor > CoinAtlas > coinmarketcap function). Specifically in “const url = `https://pro-api.coinmarketcap.com/v1/cryptocurrency/listings/latest?start=1&limit=100`” change limit=100 to any other limit, e.g. 500. Note that this increases your calls per day and this means you might have to downwards adjust your trigger for this function.
- The function “Build report” is a script which automatically calculates howmany shares you own of every asset and the average price you paid for it. If you sell a certain asset, it will use the FIFO or LIFO method to sell the asset. If you no longer own any shares of the asset, it will be deleted automatically from the sheet “Positions”. It is possible to use this to aid you in creating your tax report. Specifically, go to Menu>View>Hidden sheets>Report. This will reveal the “Report” sheet. However, everything is still in beta, so proceed with caution as spreadsheet is not desgined to do taxes for you.
- Stocks and currencies must be written in such a manner that google finance can find them. Write the stock exchange before the symbol if you receive the incorrect price, for example NYSE:GME instead of GME.
- Once you click on the “Build report”, everything inside “Positions” should be calculated automatically.
- The main output currency must be written in such a manner that “Googlefinance” can find it. Test it first in a different cell to prevent errors.
- The data on industry and sector is extracted from fidelity.
- The tracker supports by default 200 cryptocurrencies & 200 stocks, however you can extend the formula’s to support as many stocks as you wish.
- The money-weighted-average-return (MWAR) is used to calculate your “total return” over your portfolio and the different categories (stock/crypto). This formula looks at the cash inflows and cash outflows, while taking into account the current value of your portfolio. It also looks at the dates you made contributions. Make sure all these data are correct in order to have an accurate total return.
- If your portfolio is less than one year old, the MWAR will give you back an inflated number. For example if you made 10% return in one month, it will return 120%, because it will assume that you keep making this return. Learn more about the MWAR here.
- If the spreadsheet is too large or too small for your screen, go to “view” and change the “zoom”. For example I use 135% zoom as I have a 2k screen and 27 inch screen.
- The tracker supports by default 30 accounts. For the calculation of the account balance, deposits & sells are considered positive cash flow and buys & withdrawals as negative cashflow. If you move cash from account 1 to account 2, then put a withdrawal in account 1 and deposit same amount in account 2.
Description of spreadsheet
Dashboard
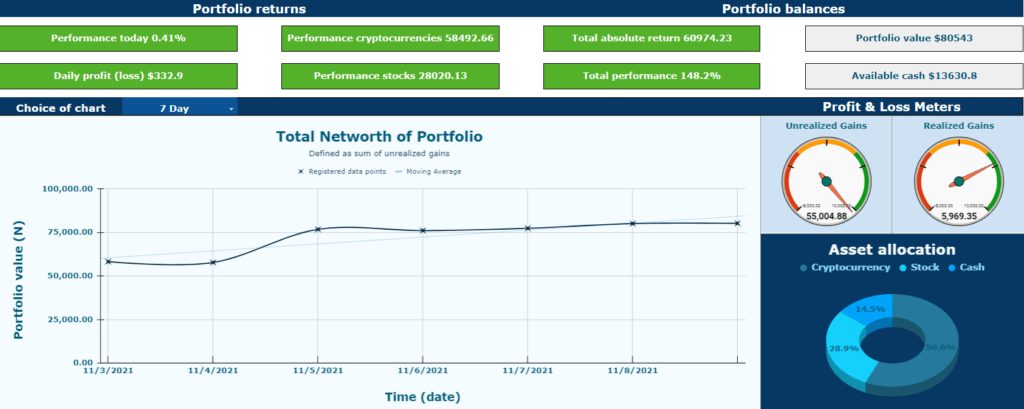
The first sheet you will encounter after the Setup sheet is the Dashboard. Here, you will find a summary of essential parts of your portfolio. On the top you will find your daily performance and the performance of your cryptocurrencies and stocks. Moreover, you can view your current cash balance and account balance on the top right. In the middle right you can see your total unrealized & realized gains.
Explanation of the metrics
– Performance today: daily profit or loss expressed as a percentage over total portfolio
– Daily profit (loss): daily profit or loss denominated in local fiat currency
– Performance cryptocurrency: total performance for the category cryptocurrency, taking both unrealized gains and realized gains into account
– Performance stocks: total performance for the category stocks, taking both unrealized gains and realized gains into account
– Total absolute return: total performance for entire portfolio, taking both unreazlied and realized gains into account
– Total performance: calculated for entire portfolio using the money-weighted rate of return formula
– Portfolio value: combined value of current holdings
– Available cash: sum of cash available over all accounts
– Unrealized gains: sum of profit (or loss) over all current holdings
– Realized gains: sum of profit (or loss) over all holdings sold completely or partially in the past
Your total net worth is tracker after the first day of setup and recorded twice per day. It is not possible to view further back than the first day of recording.
History
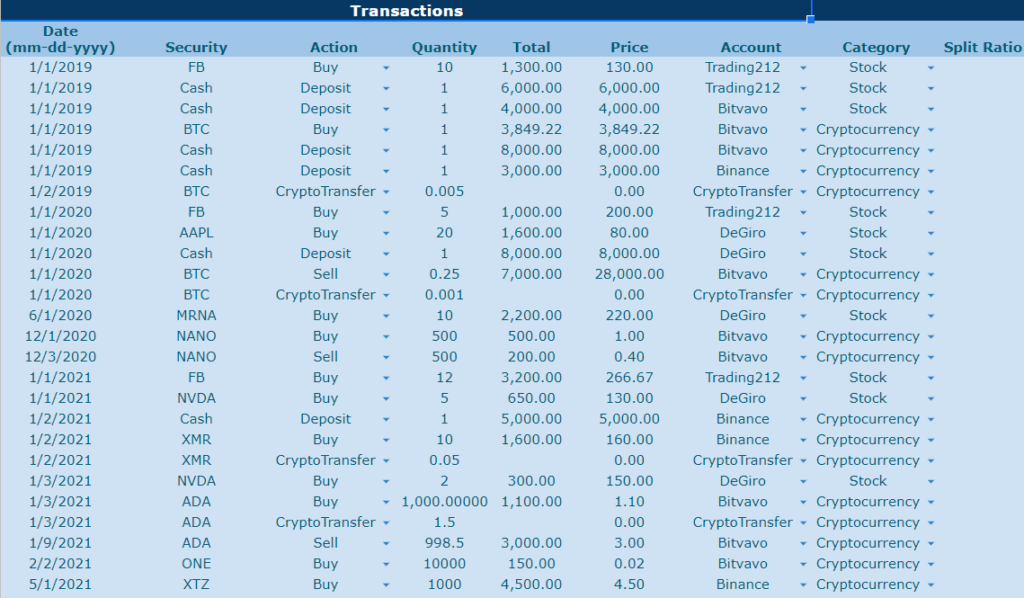
This is the data input sheet. As a user you are required to fill in this sheet with your data. The spreadsheet uses the information inside the sheet to perform calculations for the rest of the tracker. If you wish to change anything in the rest of the spreadsheet, then change the input data of the history sheet (as opposed to changing the formula’s).
Report & Summary of Report
The “Report” sheet can be used to create a tax report. It provides you information regarding the date, quantity, purchase cost and total sell price every time an asset was sold. The “Summary of RG Report” creates a summary of the “Report” sheet. Do not change anything in these sheets.
Positions
Arguably the most important sheet is located in the “Positions” tab. This sheet provides you with an overview of all your current holdings and includes key info such as average cost basis, portfolio allocation, cost basis, sector, industry, market cap, price change daily, purchase cost, position value, gains or losses and portfolio return. All the data is calculated automatically based on the History sheet. If you make any changes in the History sheet then make sure to update the tracker through the CoinAtlas menu.
Analysis of portfolio
This sheet will provide you with a graphical overview of your investments which will help you in your future decision. You may gain some insights by assessing the different allocations within your portfolio and determining if re-balancing is necessary. Furthermore, you may gain various insight from the different allocations in your investment accounts, industry, sector and allocation by market cap size.
Investor Return
The final sheet on the investment tracker will provide you with an overview of all your returns over one holding period. In the drop-down list in cell “K4” you can chose whether you wish to view your total portfolio, cryptocurrencies or stocks. Moreover, you can switch between realized gains and unrealized gains by changing the value in cell “F4”. The graphs in the sheet are linked dynamically, meaning they will change based on the values of the drop-down list and any changes made in the “History” sheet. The first chart will provide you with gains or losses for an individual asset, the second chart will provide you with your portfolio return. This is especially useful since one of your holdings may have lost 90% of its value, however, if you only spend a $100 dollar on that holding the impact on your total return might be minimal. The third chart shows your total absolute return denominated in your local fiat currency, both for realized gains and unrealized gains. The final charts are gauge meters displaying your total return according to the money-weighted rate of return and the total amount of dividends received.
Newsfeed
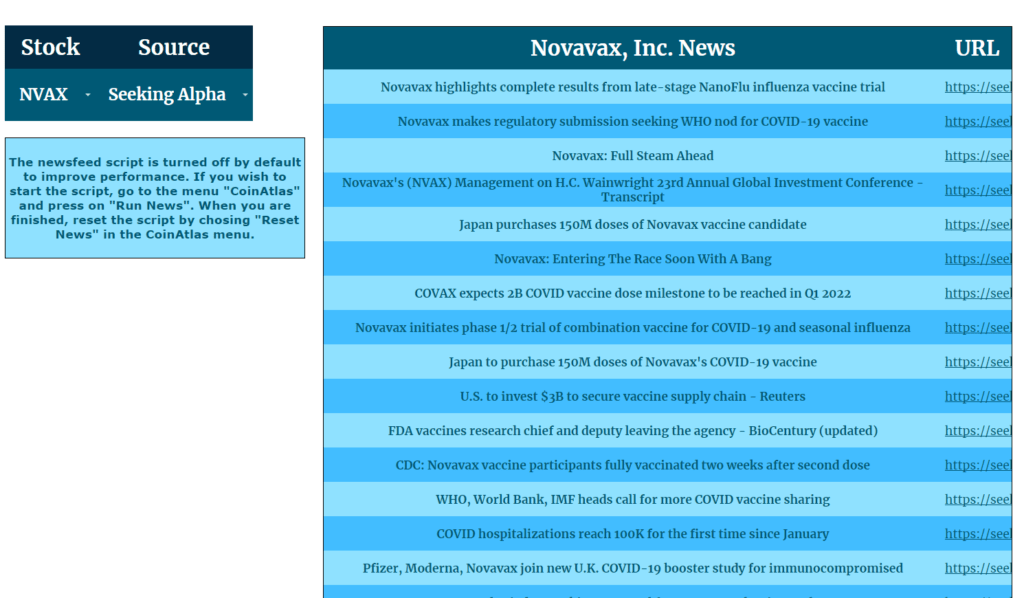
In the Newsfeed sheet you can go to cell “D7” and click on the arrow and you will be presented with a drop-down list of all your stock holdings. Chose one stock holding and then click on the source of your chosing. For stocks you can chose from “Seeking Alpha” or from “Yahoo Finance”. If you are not interested in news from stocks, you can also chose to look up general news on cryptocurrency from “Cryptoninjas”, “Coindesk” or “Cointelegraph”.
Financial Screener
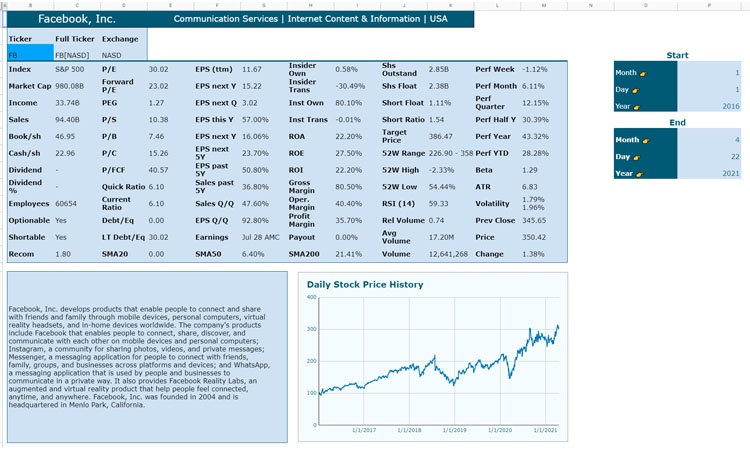
The next tool available for your use is the “Financial Summary”. This sheet extract a table from finviz.com. The table provides you financial information on a specific stock. Enter in cell “C3” the symbol of the stock you are interested in. The table should update automatically. Unfortunatly, finviz only supports US stocks. A graph displaying the historical price is also present. You can change the graph by entering a different date in cell “P4” up and till cell “P10”.
Watchlist
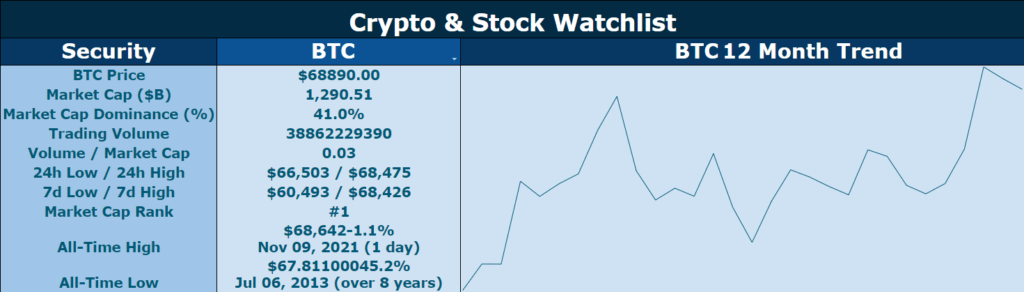
The watchlist tool can help you keep track of what is happening with your current holdings. You can click on cell “C9” and chose any one of your holdings (cryptocurrencies or stocks) and receive relevent information regarding the price action of the asset.
0 Comments